2.3. Trading Food Business Establishments
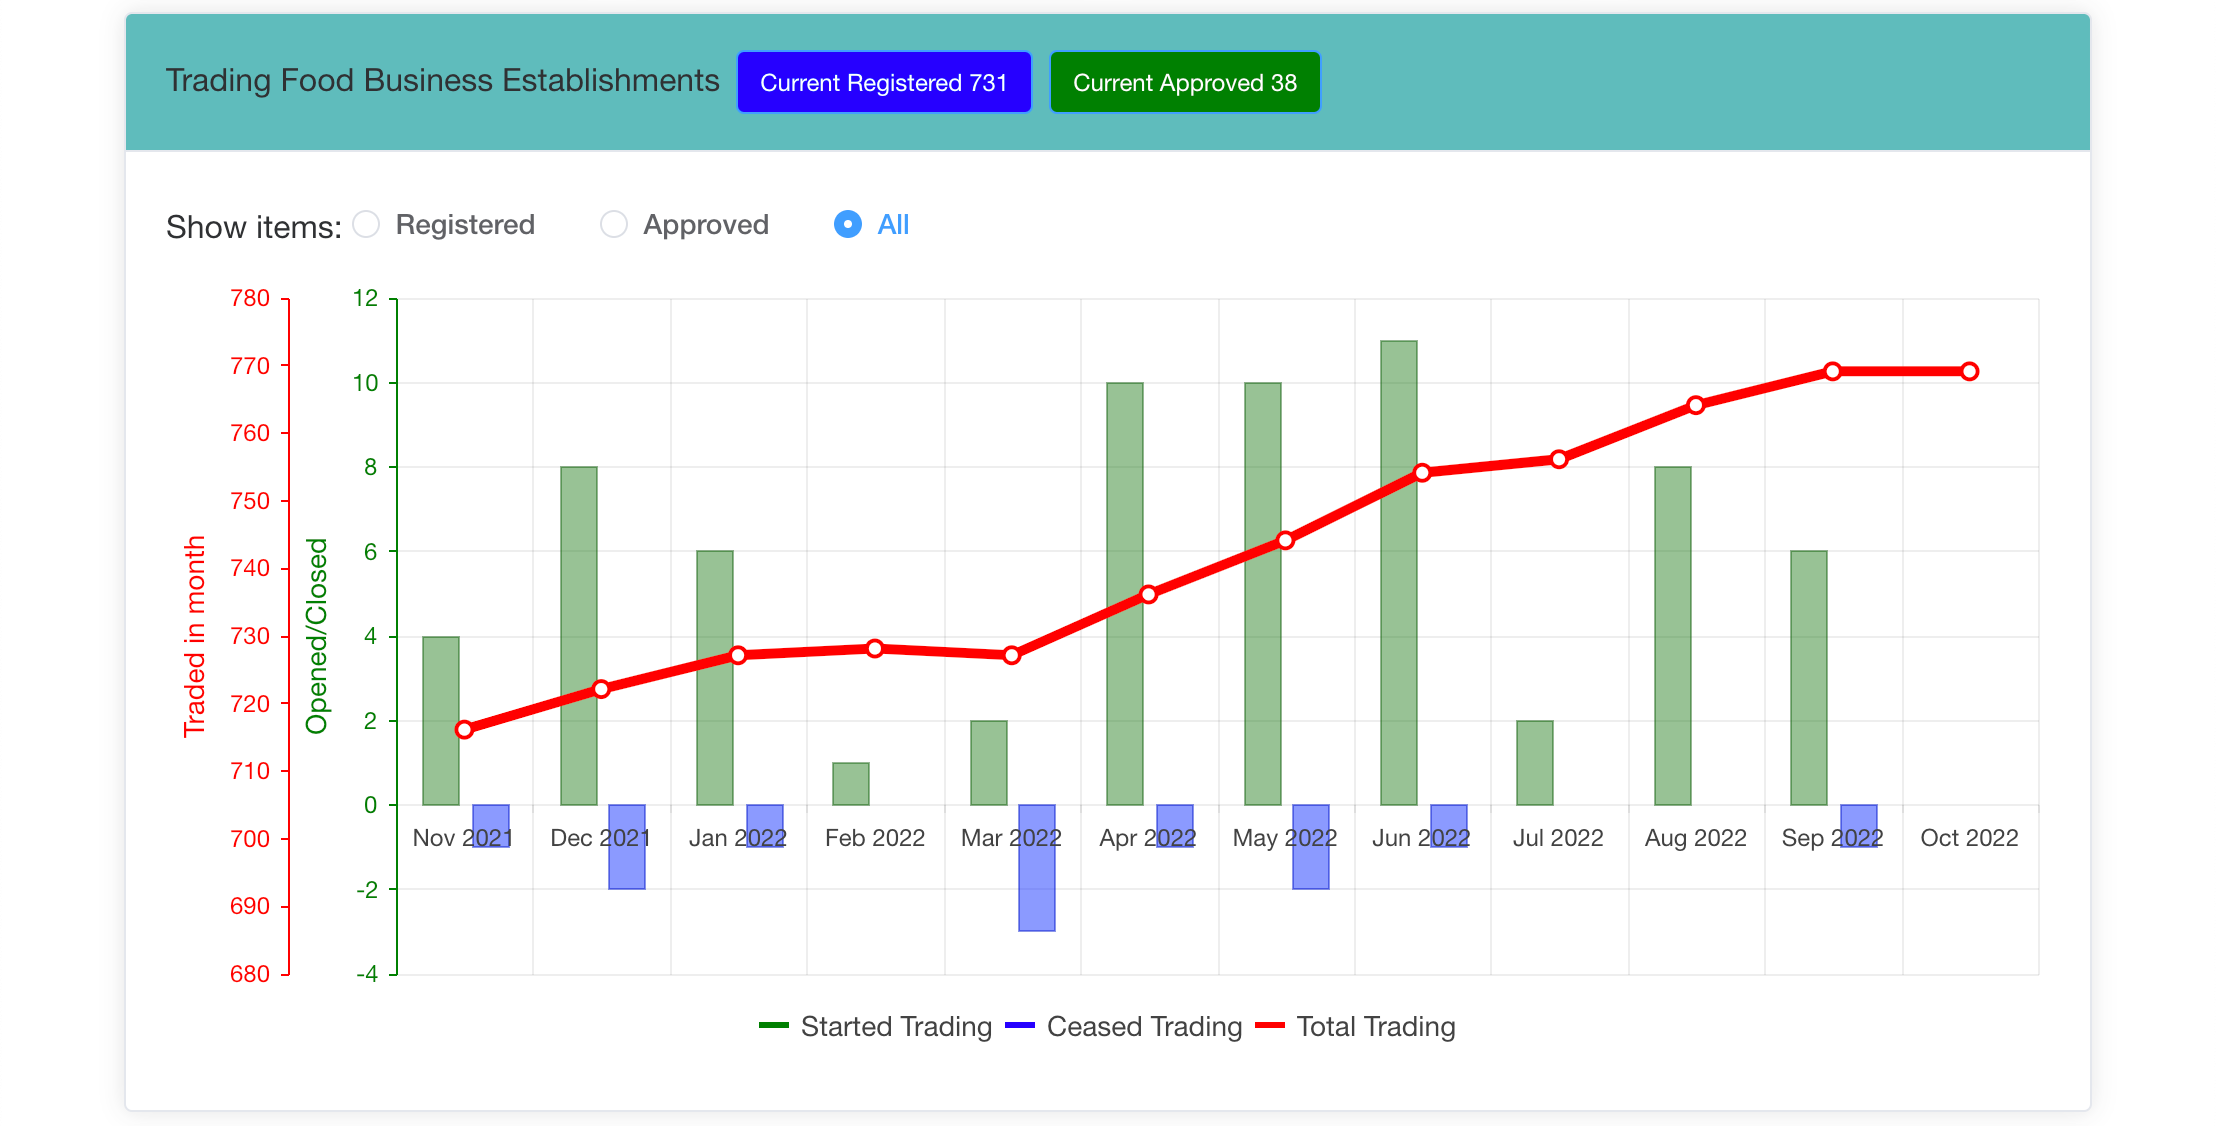
This chart has two Y Axis. The red Y axis and red line show the total number of food businesses trading at any point in the selected timeline. The green axis shows the number of businesses registered (green bar) or closed (purple bar) in any month in the selected timeline.
There are toggle buttons to toggle between showing just Registered food businesses, just Approved food businesses, and All food businesses.
Hover over the chart to see Tool Tips.
Click on any green or purple bar to be taken to a dashboard showing all relevant food businesses.