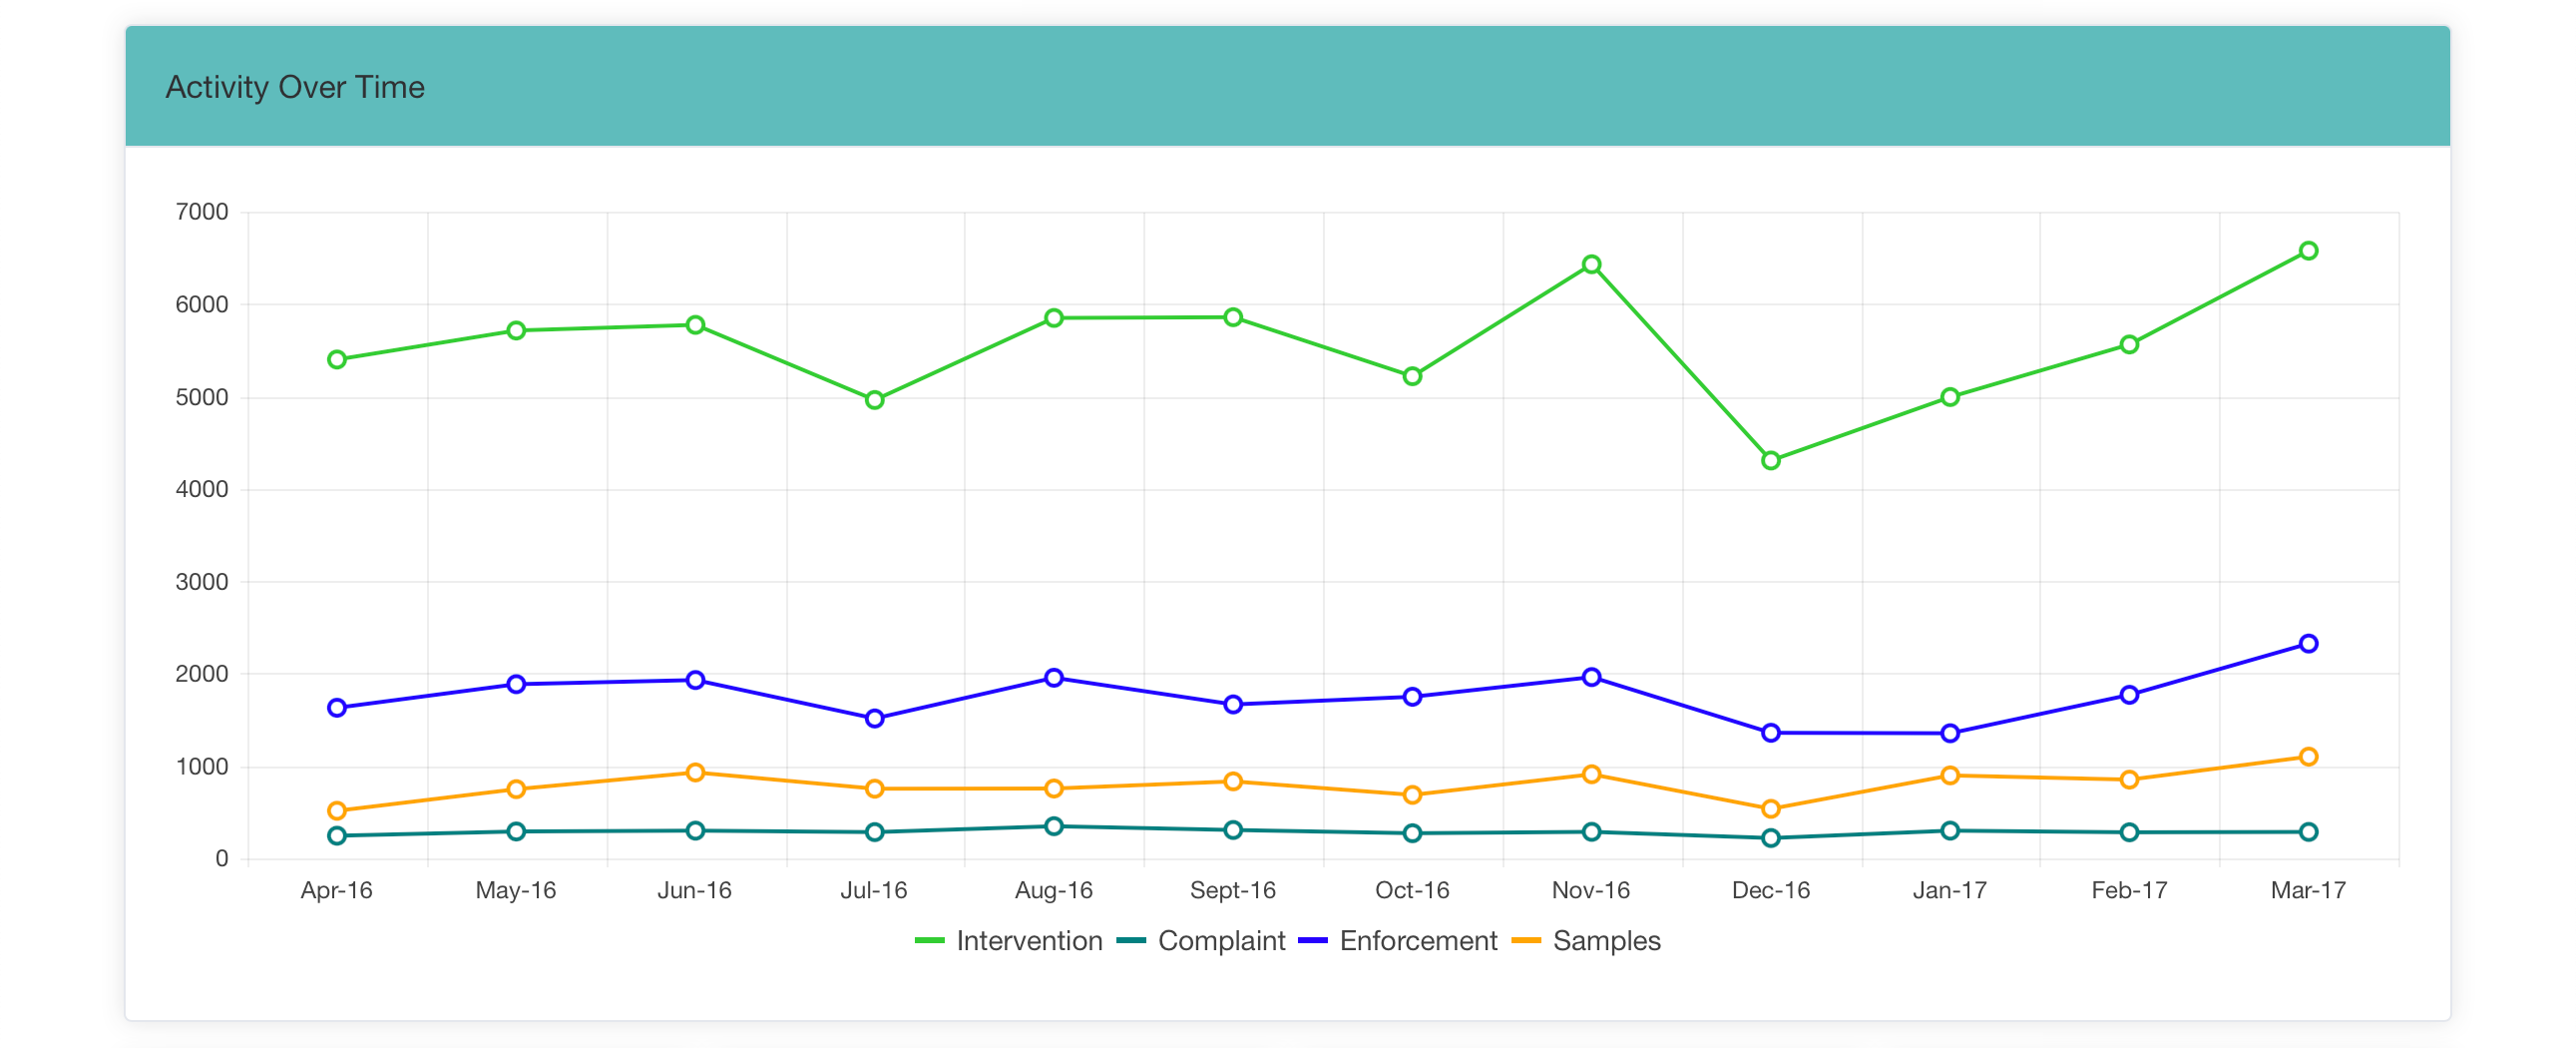
6.1.2. Activity Over Time
This chart shows the number of Interventions, Complaints (Service Requests), Enforcement Actions (Notices and Letters) and Samples taken over the time period selected. Click on the chart legend to toggle any item on / off. Hover over the chart to see Tool Tips.
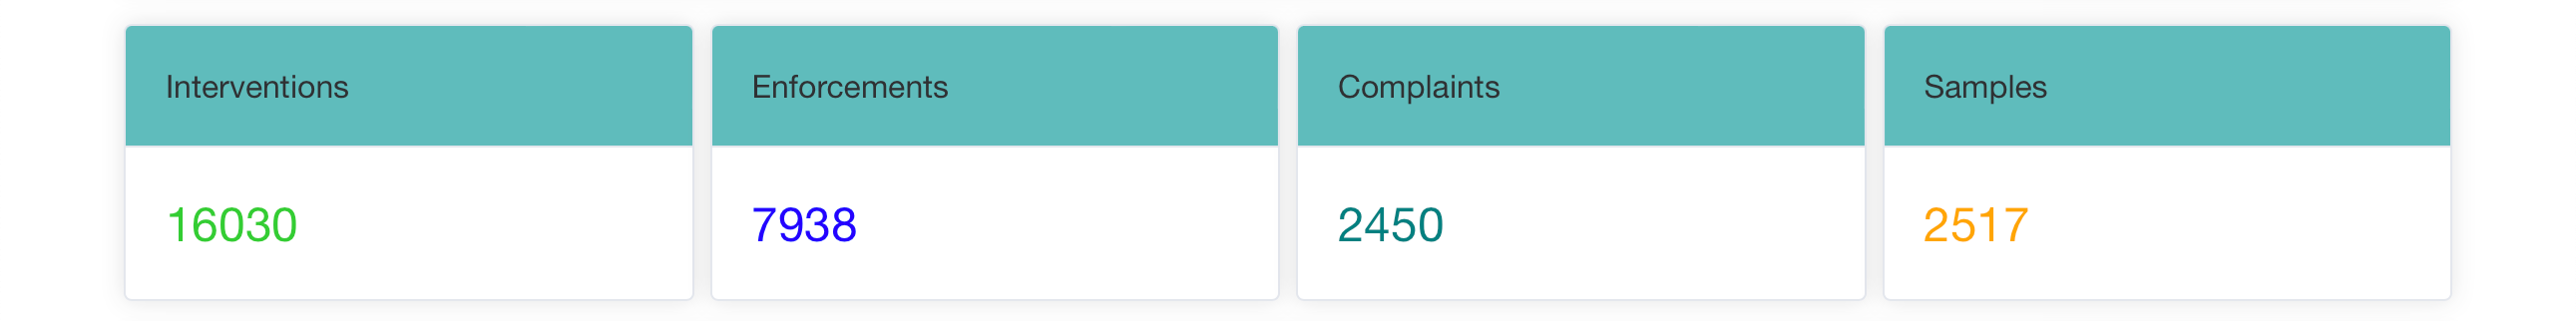
The summary figures shown in the boxes below the chart show the total number of Interventions, Complaints (service requests), Enforcement Actions (notices and letters) and samples over the time period selected.